
A Lesser-known Feature of Creating Plots with Plotly
Enrich static plots with animations.

Plotly is pretty diverse when it comes to creating different types of charts. While many folks prefer it for interactivity, you can also use it to create animated plots.
Here's an animated visualization depicting the time taken by light to reach different planets after leaving the Sun.
Several functions in Plotly support animations using the animation_frame and animation_group parameters.
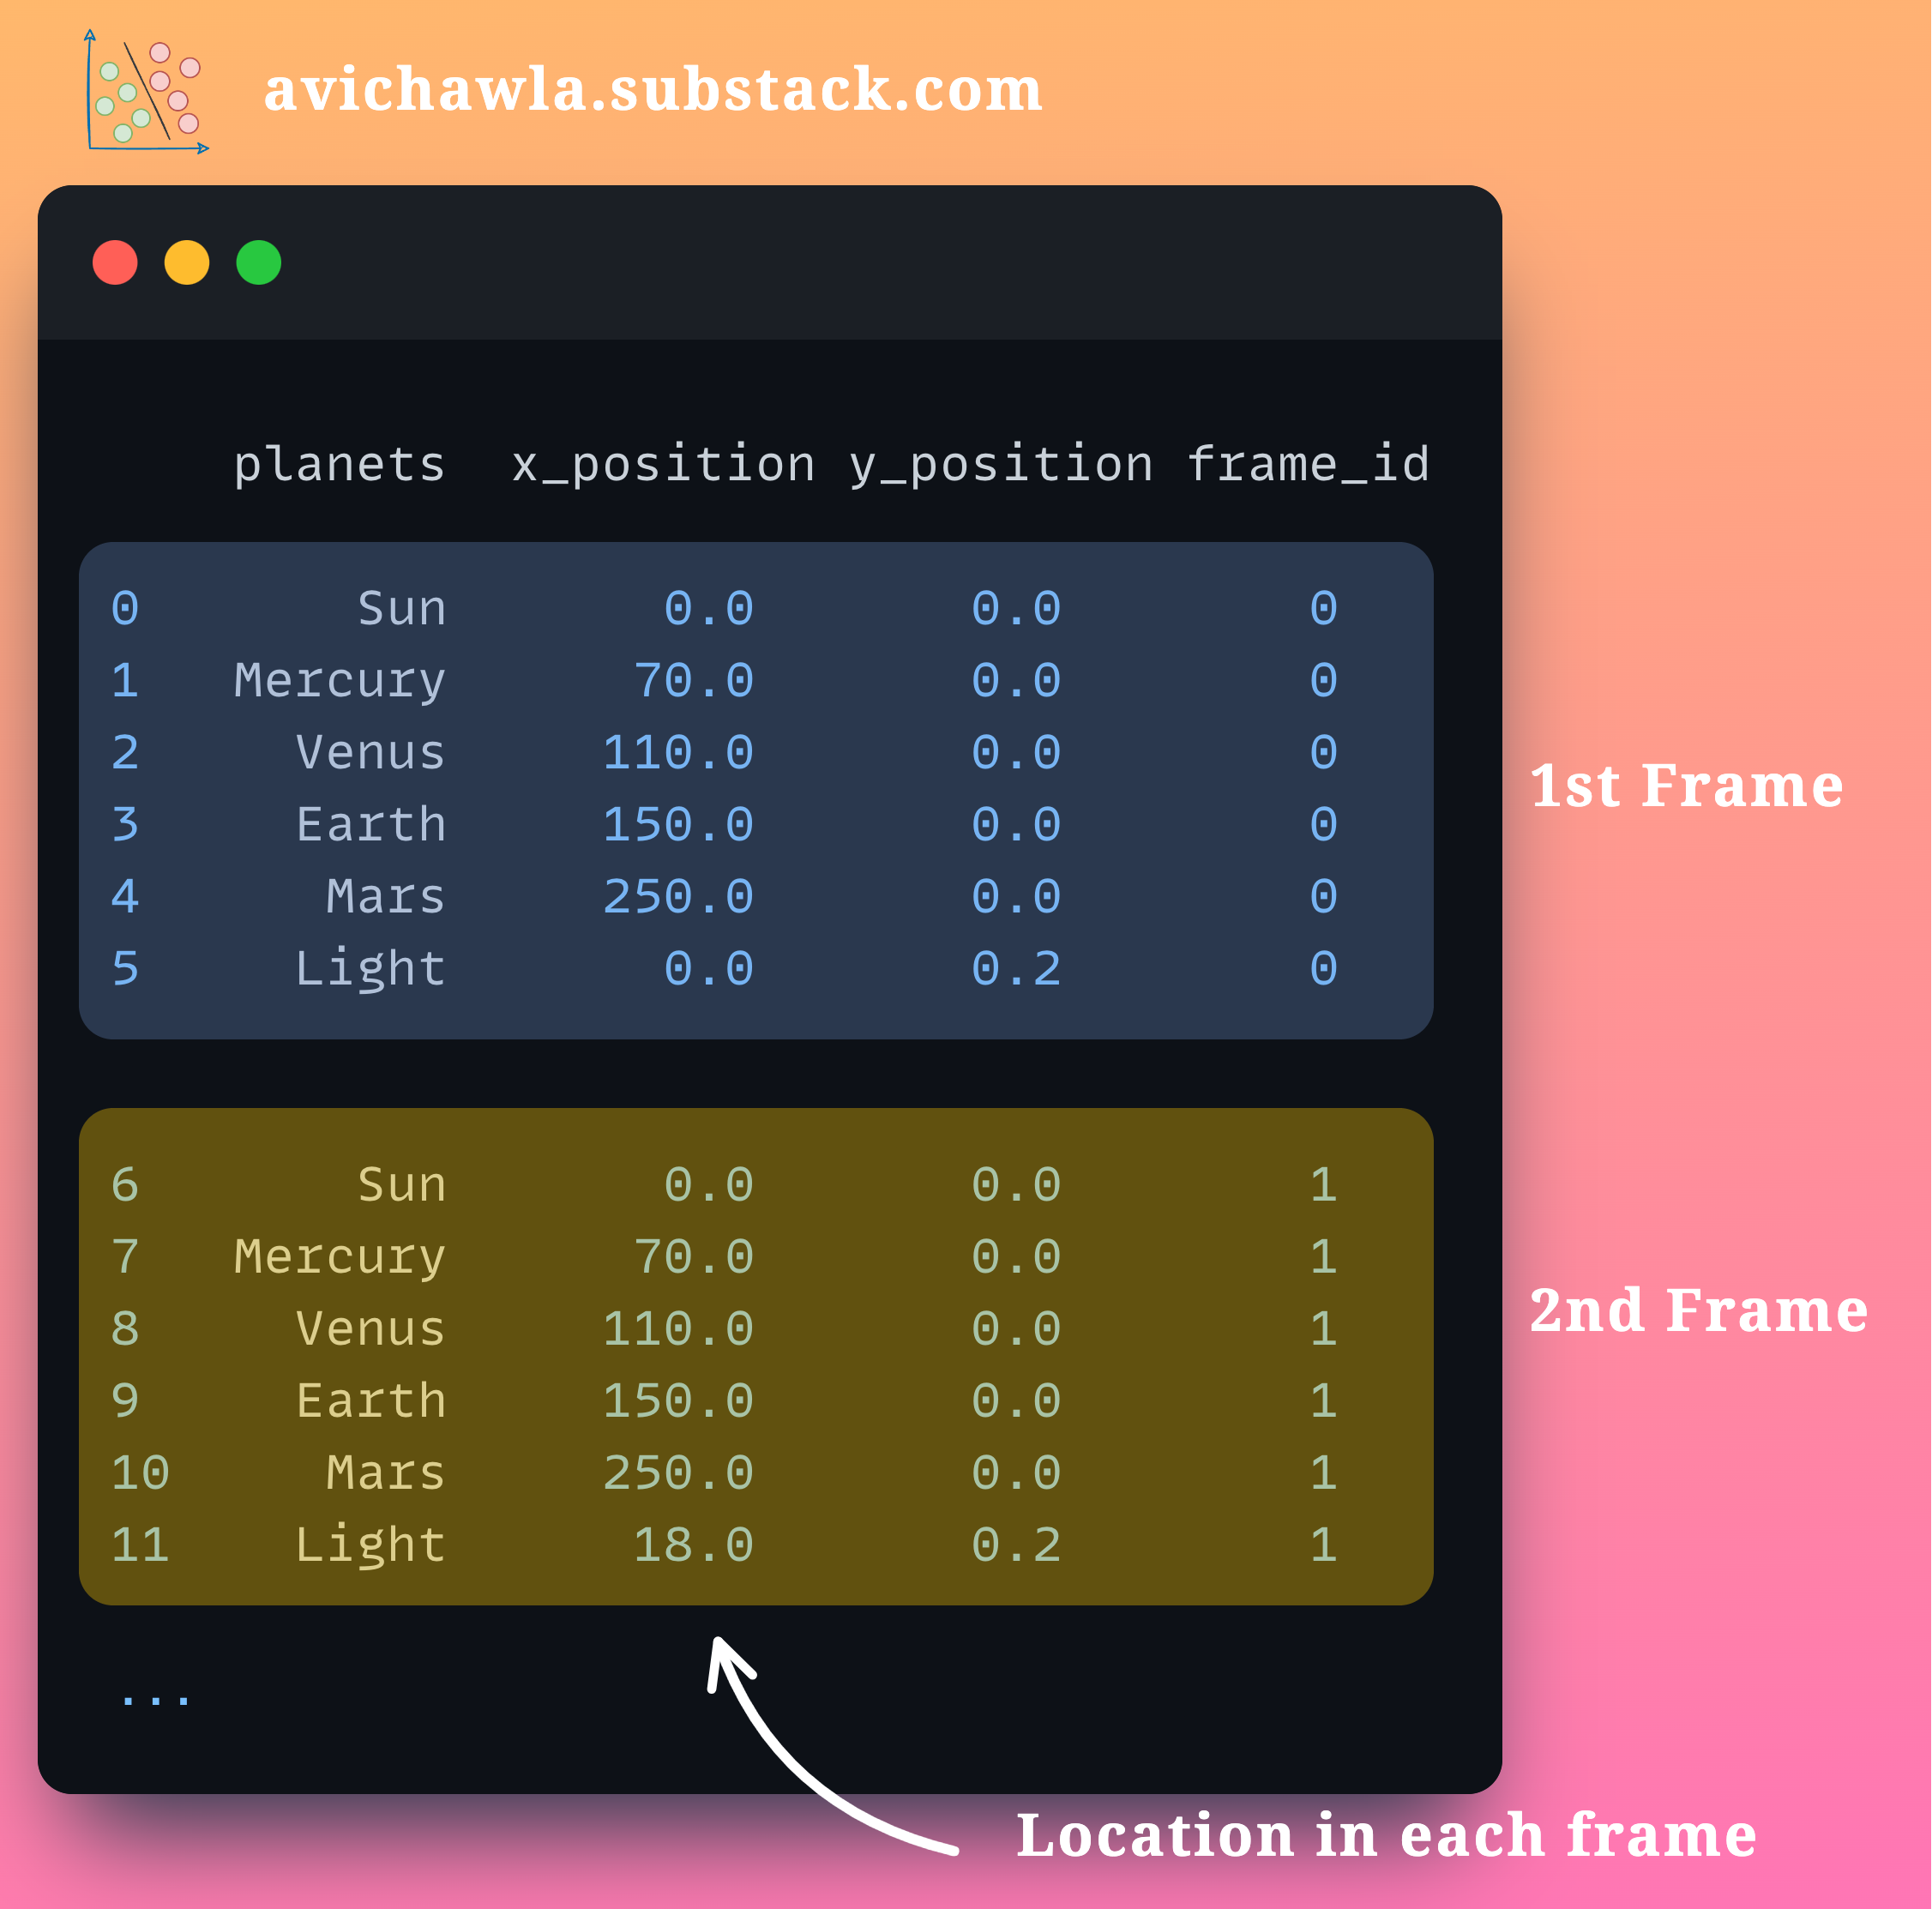
The core idea behind creating an animated plot relies on plotting the data one frame at a time.
For instance, consider we have organized the data frame-by-frame, as shown below:
Now, if we invoke the scatter method with the animation_frame argument, it will plot the data frame-by-frame, giving rise to an animation.
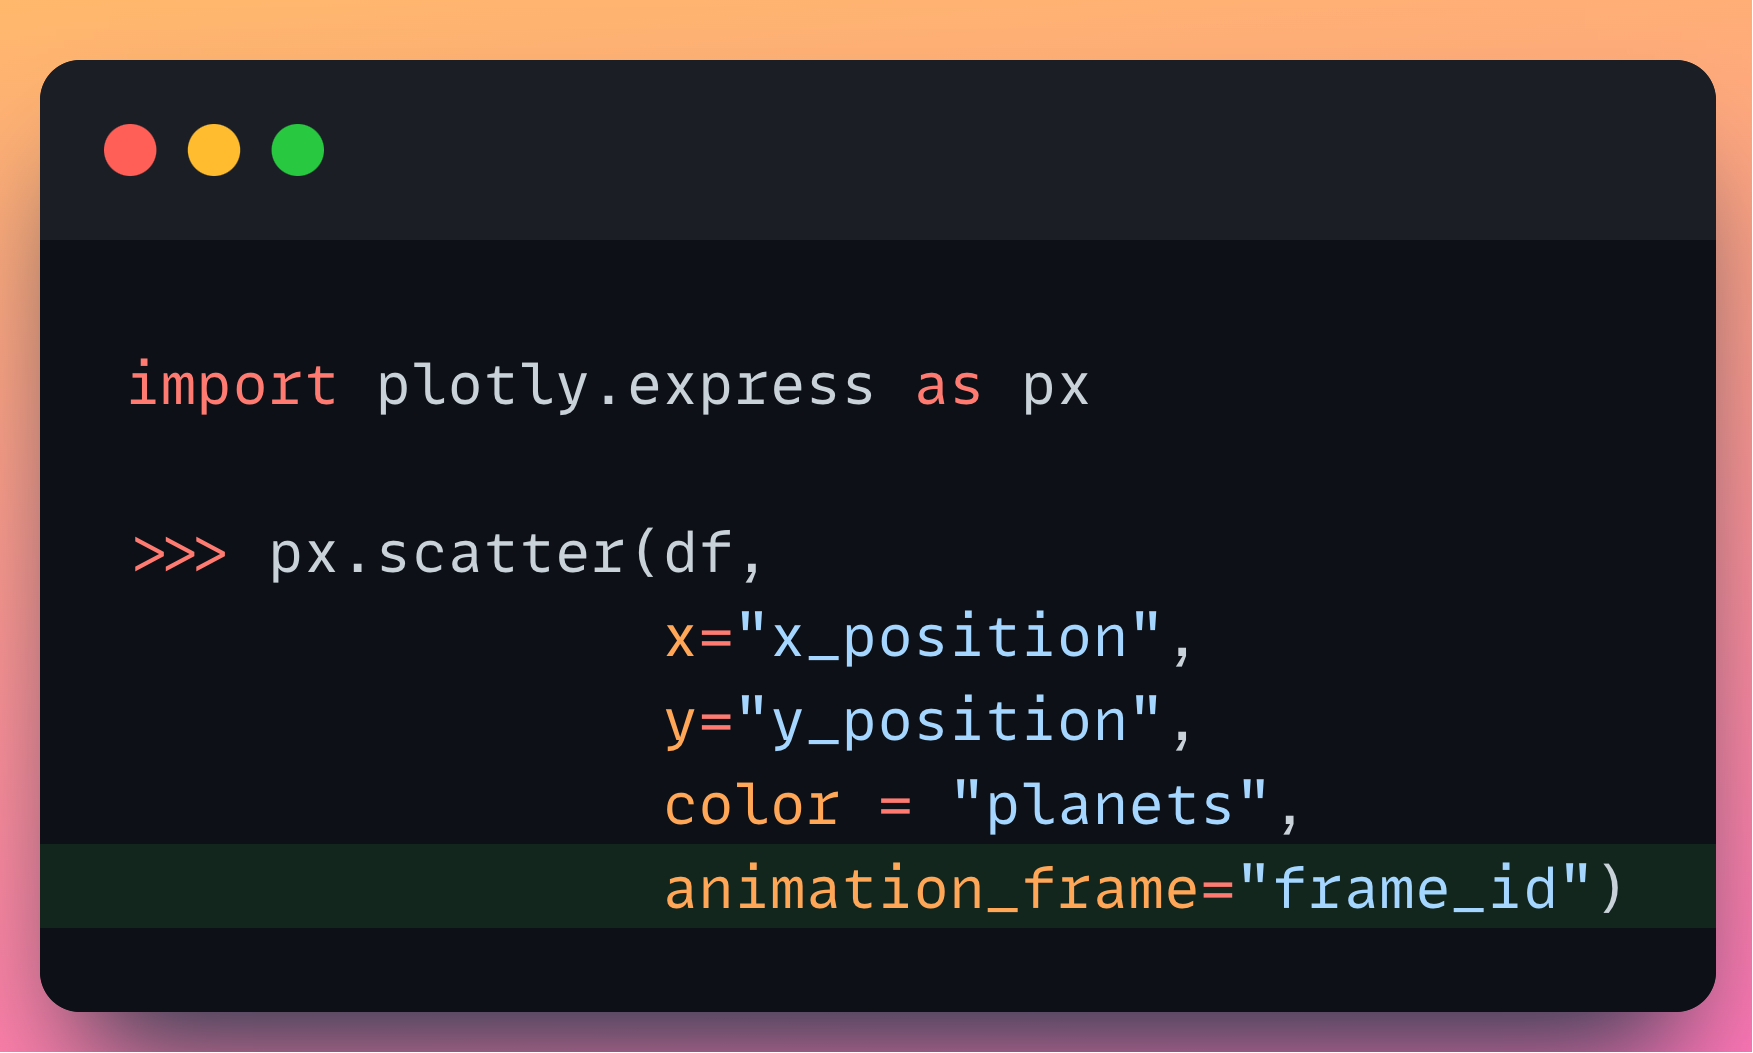
In the above function call, the data corresponding to frame_id=0 will be plotted first. This will be replaced by the data with frame_id=1 in the next frame, and so on.
Find the code for this post here: GitHub.
👉 Read what others are saying about this post on LinkedIn.
👉 Tell me you liked this post by leaving a heart react ❤️.
👉 If you love reading this newsletter, feel free to share it with friends!
I like to explore, experiment and write about data science concepts and tools. You can read my articles on Medium. Also, you can connect with me on LinkedIn and Twitter.
I love this. I can think of a dozen applications for this with my work. Thanks
This is a nice intro to a unique data visualization technique. Thanks for sharing.