
A Visual and Intuitive Guide to The Bias-Variance Problem
The histogram analogy.

The concepts of overfitting and underfitting are pretty well understood by most folks.
Yet, here’s another neat way to understand them intuitively.
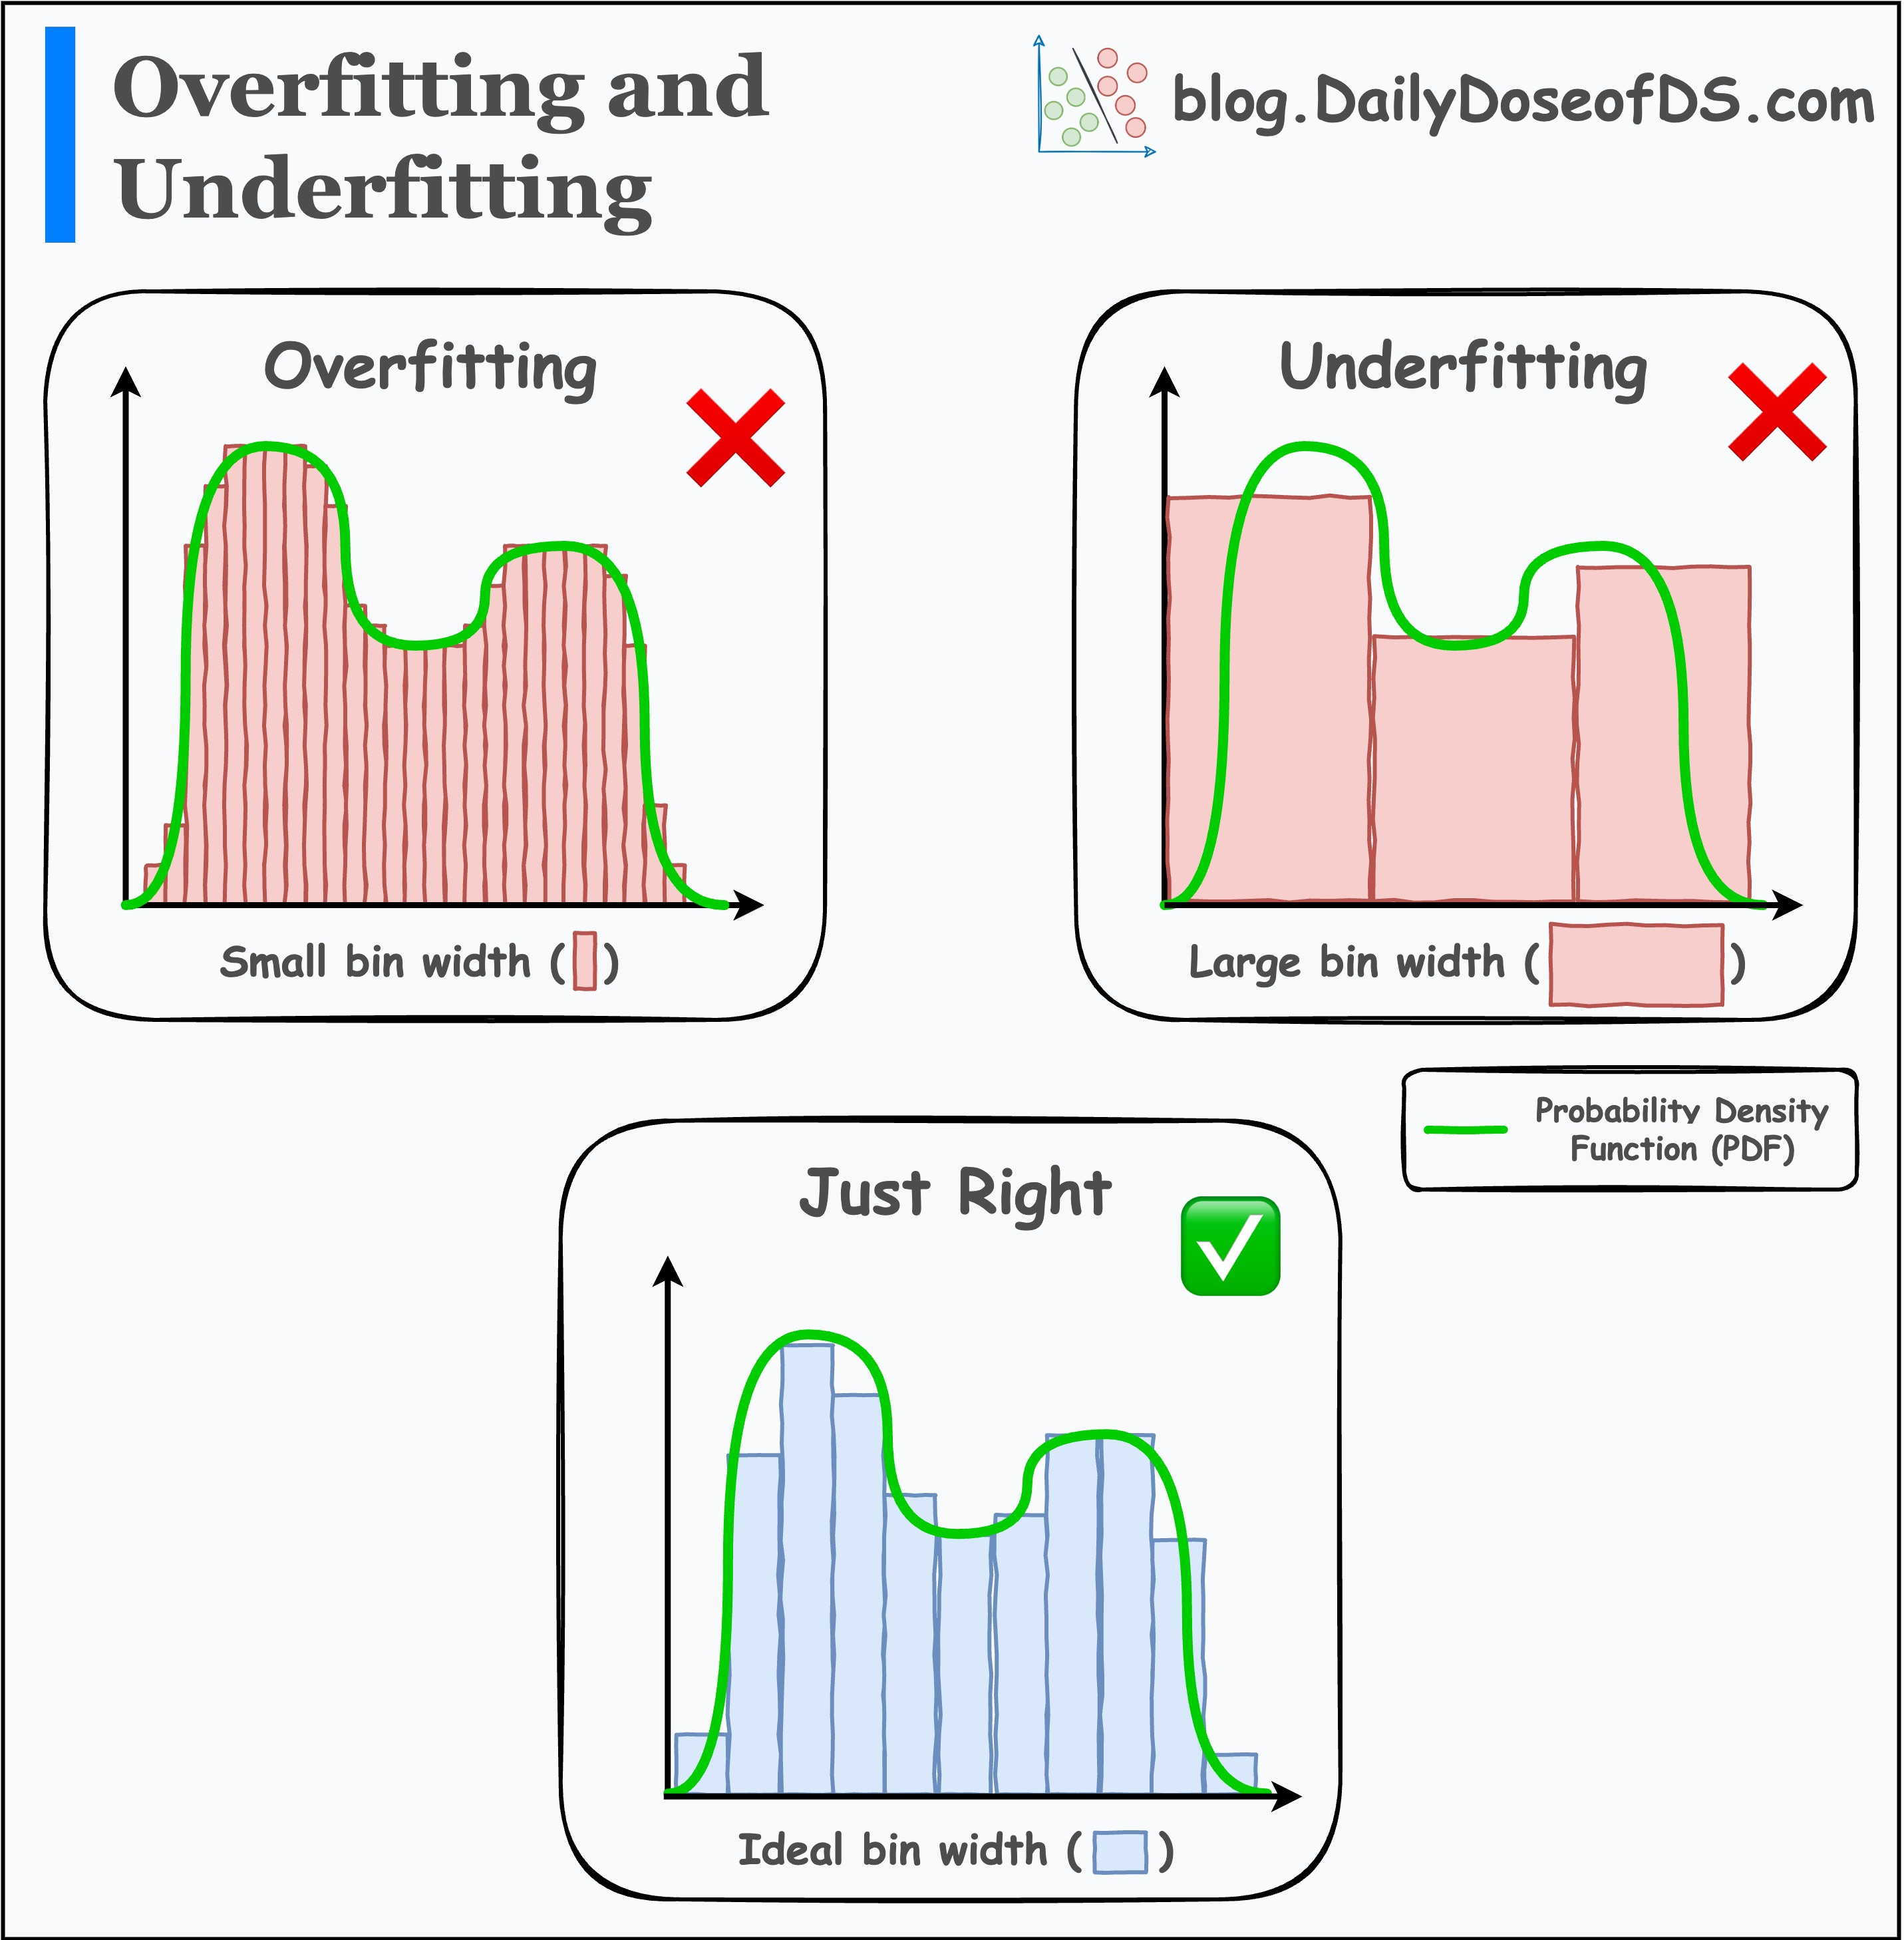
Imagine you want to estimate a probability density function (PDF) using a histogram.
Your estimation entirely depends on the bin width:
Creating small bins will overfit the PDF. This leads to high variance.
Creating large bins will underfit the PDF. This leads to high bias.
This is depicted in the image above.
Overall, the whole bias-variance problem is about finding the optimal bin width.
I first read this analogy in the book “All of Statistics” a couple of years back and found it to be pretty intuitive and neat.
Here’s the book if anyone’s interested in learning more: All of Statistics PDF. Page 306 inspired today’s post.
Hope that helped :)
👉 If you liked this post, don’t forget to leave a like ❤️. It helps more people discover this newsletter on Substack and tells me that you appreciate reading these daily insights. The button is located towards the bottom of this email.
👉 Over to you: What are some other analogies to understand the Bias-Variance problem?
Thanks for reading!
Whenever you’re ready, here are a couple of more ways I can help you:
Get the full experience of the Daily Dose of Data Science. Every week, receive two curiosity-driven deep dives that:
Make you fundamentally strong at data science and statistics.
Help you approach data science problems with intuition.
Teach you concepts that are highly overlooked or misinterpreted.

Promote to 29,000 subscribers by sponsoring this newsletter.
👉 Tell the world what makes this newsletter special for you by leaving a review here :)
👉 If you love reading this newsletter, feel free to share it with friends!
The disadvantage of overfitting would be better illustrated if the "measured signal/data" incorporated a few "dents" and "bumps" (of the kind one wouldn't want fitted).