
A Visual and Overly Simplified Guide to PCA
A step-by-step explanation to PCA.


Many folks often struggle to understand the core essence of principal component analysis (PCA), which is widely used for dimensionality reduction. Here's a simplified visual guide depicting what goes under the hood.
In a gist, while reducing the dimensions, the aim is to retain as much variation in data as possible.
To begin with, as the data may have correlated features, the first step is to determine a new coordinate system with orthogonal axes. This is a space where all dimensions are uncorrelated.
The above space is determined using the data's eigenvectors.
Next, we find the variance of our data along these uncorrelated axes. The variance is represented by the corresponding eigenvalues.

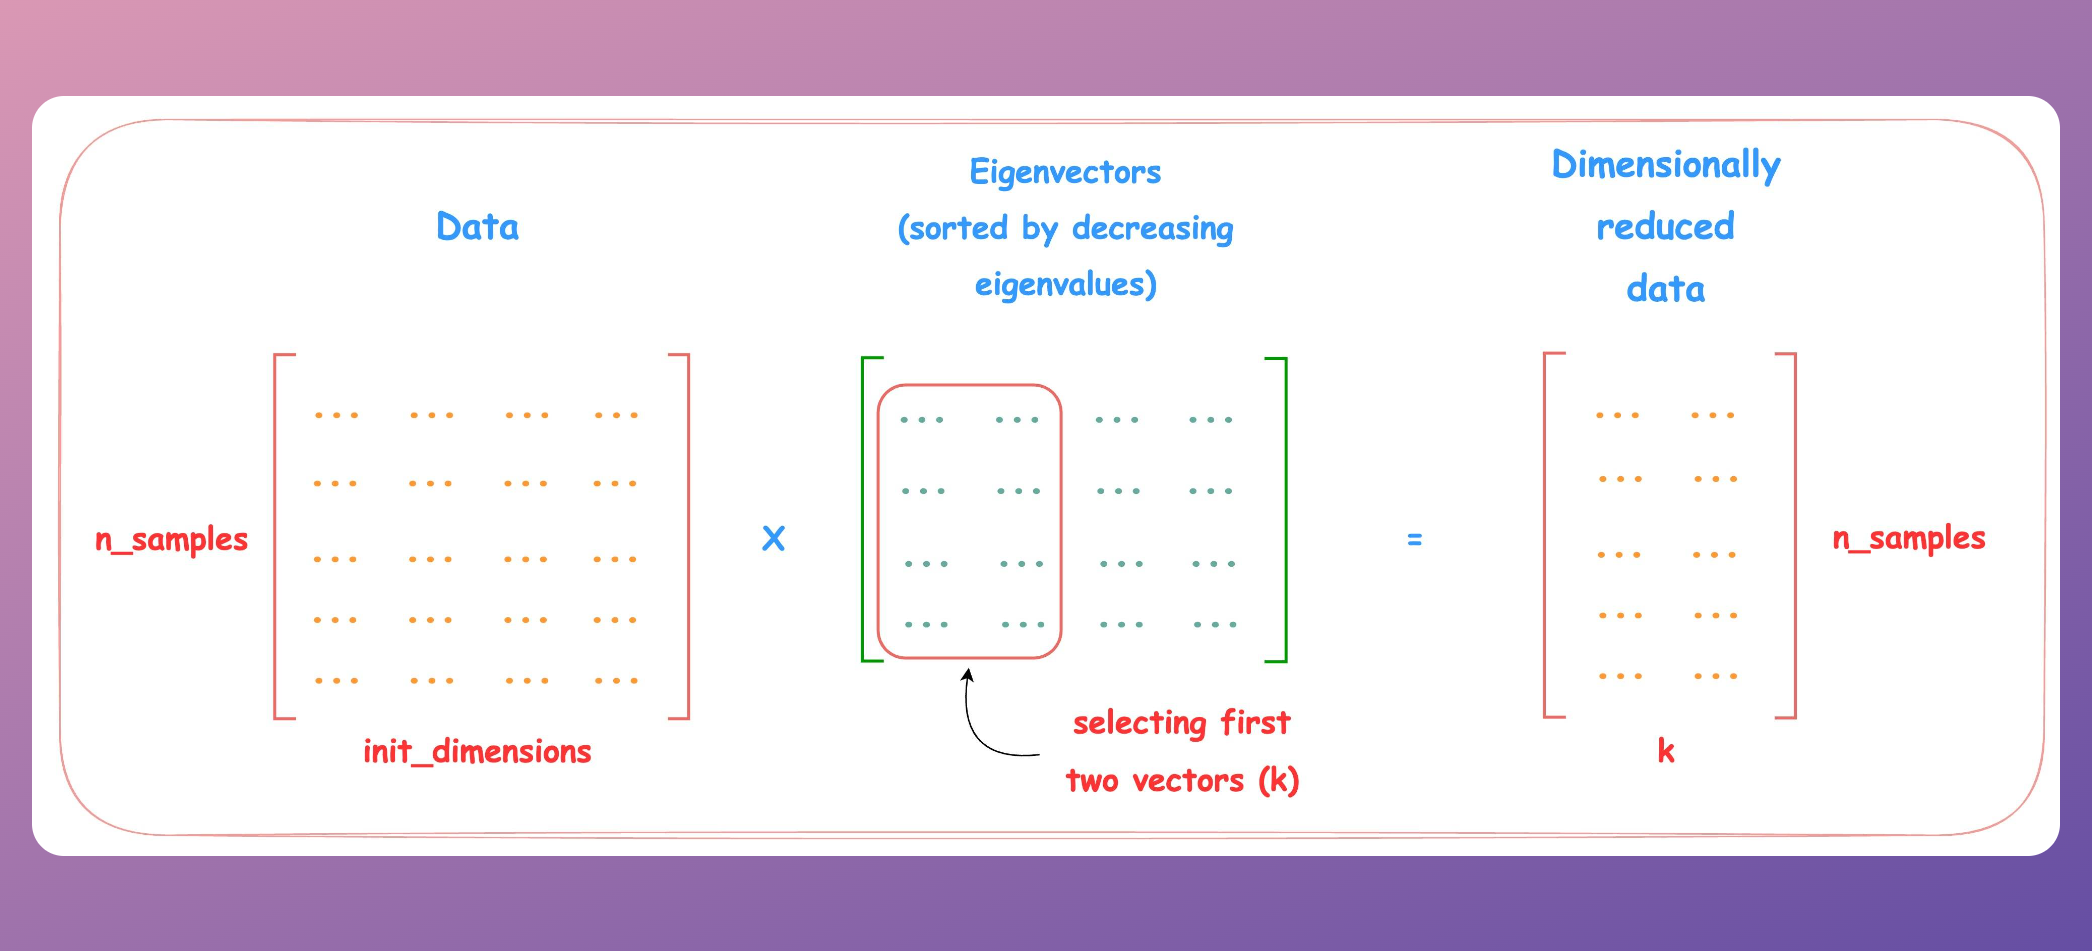
Next, we decide the number of dimensions we want our data to have post-reduction (a hyperparameter), say two. As our aim is to retain as much variance as possible, we select two eigenvectors with the highest eigenvalues.
Why highest, you may ask? As mentioned above, the variance along an eigenvector is represented by its eigenvalue. Thus, selecting the top two eigenvalues ensures we retain the maximum variance of the overall data.
Lastly, the data is transformed using a simple matrix multiplication with the top two vectors, as shown below:
After reducing the dimension of the 2D dataset used above, we get the following.

This is how PCA works. I hope this algorithm will never feel daunting again :)
👉 Read what others are saying about this post on LinkedIn.
👉 Tell me you liked this post by leaving a heart react ❤️.
👉 If you love reading this newsletter, feel free to share it with friends!
Find the code for my tips here: GitHub.
I like to explore, experiment and write about data science concepts and tools. You can read my articles on Medium. Also, you can connect with me on LinkedIn and Twitter.
Thank you!
Thank you!, stratight to the point!, you've got great skill in summarizing complex things to something more manageable. Please keep it up.