CNN Explainer: Interactively Visualize a Convolutional Neural Network
..to build an intuitive understanding.
Convolutional Neural Networks (CNNs) have been a revolutionary deep learning architecture in computer vision.
On a side note, we know that CNNs are mostly used for computer vision tasks etc. But they are also used in NLP applications too. Further reading.
The core component of a CNN is convolution, which allows them to capture local patterns, such as edges and textures, and helps in extracting relevant information from the input.
Yet, at times, understanding:
how CNNs internally work
how inputs are transformed
what is the representation of the image after each layer
how convolutions are applied
how pooling operation is applied
how the shape of the input changes, etc.
…is indeed difficult.
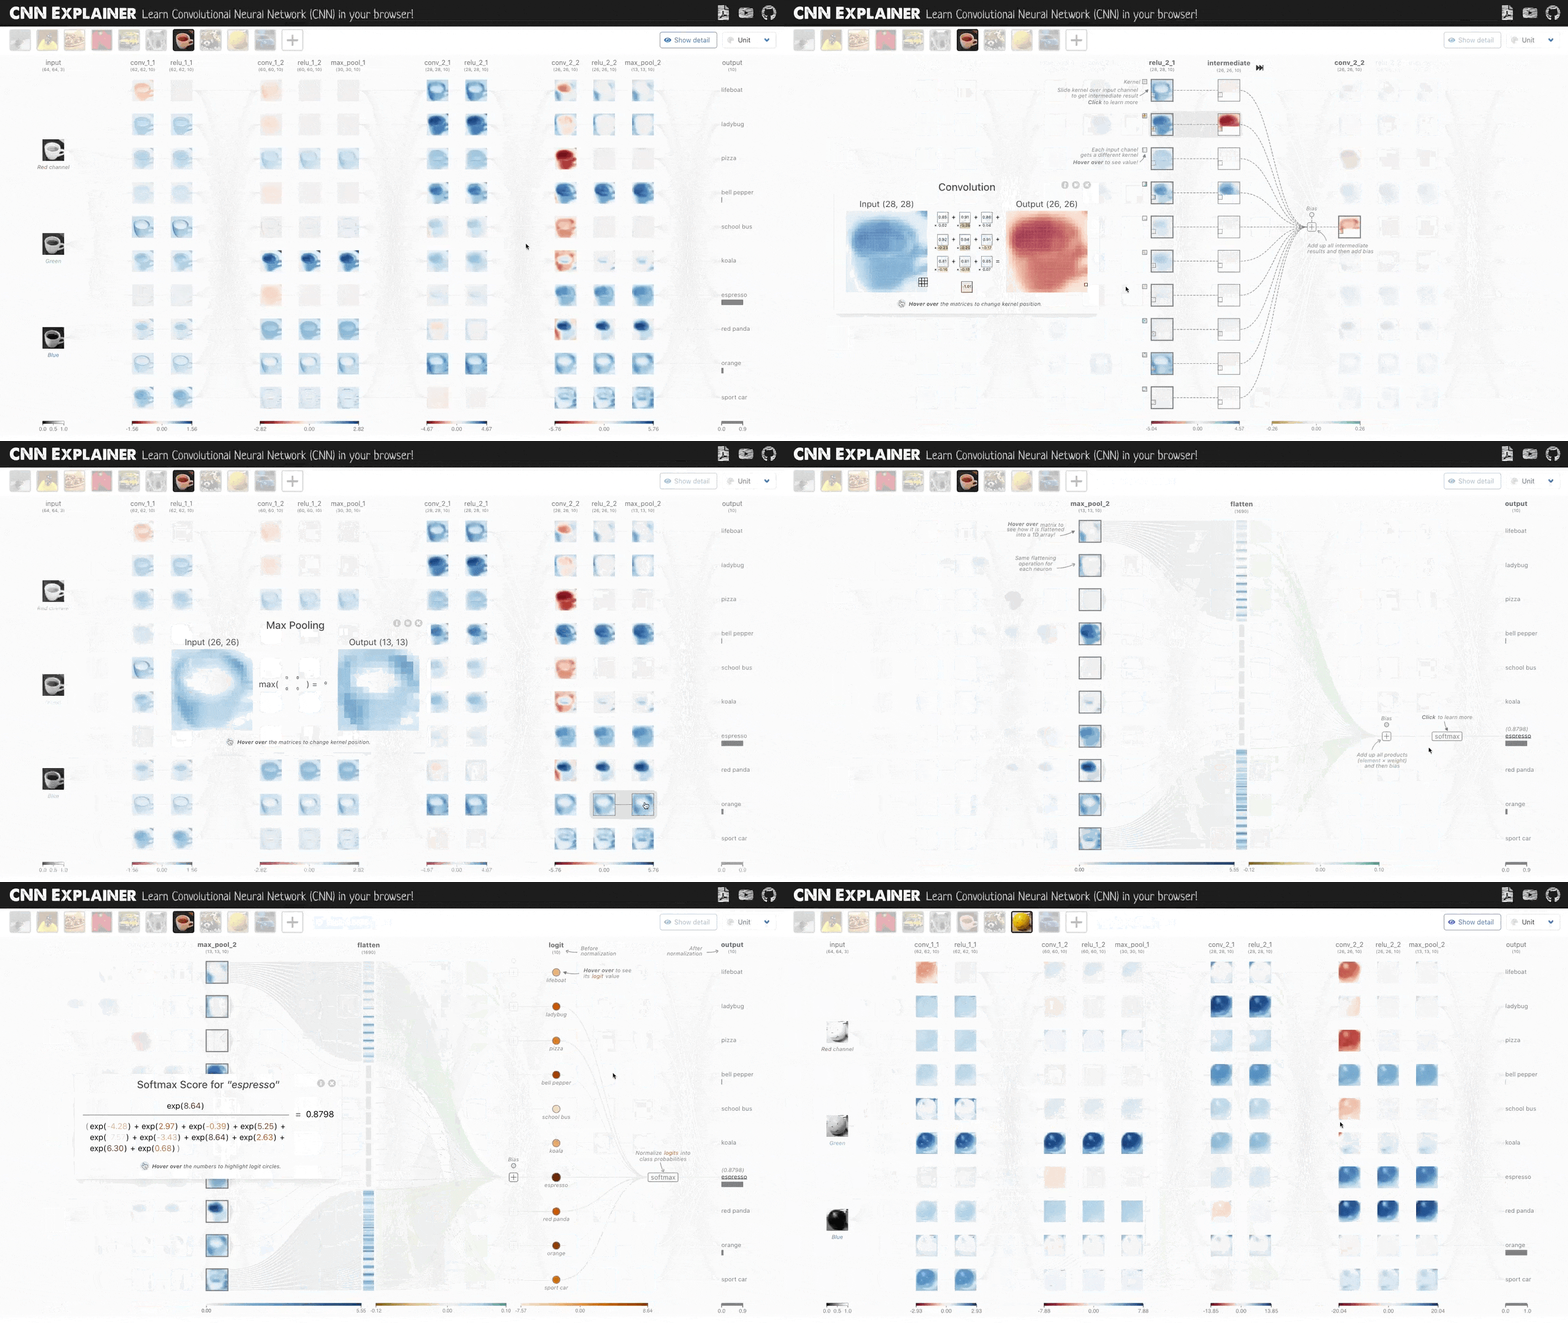
If you have ever struggled to understand CNN, you should use CNN Explainer.
It is an incredible interactive tool to visualize the internal workings of a CNN.
Essentially, you can play around with different layers of a CNN and visualize how a CNN applies different operations.
Try it here: CNN Explainer.
👉 Over to you: What are some interactive tools to visualize different machine learning models/architectures, that you are aware of? Let me know :)
👉 Read what others are saying about this post on LinkedIn and Twitter.
👉 Tell the world what makes this newsletter special for you by leaving a review here :)
👉 If you liked this post, don’t forget to leave a like ❤️. It helps more people discover this newsletter on Substack and tells me that you appreciate reading these daily insights. The button is located towards the bottom of this email.
👉 If you love reading this newsletter, feel free to share it with friends!
Find the code for my tips here: GitHub.
I like to explore, experiment and write about data science concepts and tools. You can read my articles on Medium. Also, you can connect with me on LinkedIn and Twitter.


