
Nine Most Important Distributions in Data Science
...in a single frame

Analyzing and modeling data sits at the core of data science.
A fundamental aspect of this process is understanding the underlying distributions that govern the data.
Distributions offer a concise way to:
model and analyze data,
understand the underlying characteristics of data
make informed decisions and draw insights and much more.
Thus, it is crucial to be aware of some of the most important distributions in data science.
Normal Distribution

Normal distribution PDF The most widely used distribution in data science.
It is a continuous probability distribution characterized by a symmetric bell-shaped curve.
It is parameterized by two parameters—mean and standard deviation.
Example: Height of individuals.
Bernoulli Distribution

Bernouilli PDF A discrete probability distribution that models the outcome of a binary event.
It is parameterized by one parameter—the probability of success.
Example: Modeling the outcome of a single coin flip.
Binomial Distribution

Binomial Distribution PDF It is Bernoulli distribution repeated multiple times.
A discrete probability distribution that represents the number of successes in a fixed number of independent Bernoulli trials.
It is parameterized by two parameters—the number of trials and the probability of success.
Poisson Distribution

Poisson Distribution PDF A discrete probability distribution that models the number of events occurring in a fixed interval of time or space.
It is parameterized by one parameter—lambda, the rate of occurrence.
Example: Analyzing the number of goals a team will score during a specific time period.
Exponential Distribution

Exponential Distribution PDF A continuous probability distribution that models the time between events occurring in a Poisson process.
It is parameterized by one parameter—lambda, the average rate of events.
Example: Analyzing the time between goals scored by a team.
Gamma Distribution

Gamma Distribution PDF It is a variation of the exponential distribution.
A continuous probability distribution that models the waiting time for a specified number of events in a Poisson process.
It is parameterized by two parameters—alpha (shape) and beta (rate).
Example: Analysing the time it would take for a team to score, say, three goals.
Beta Distribution
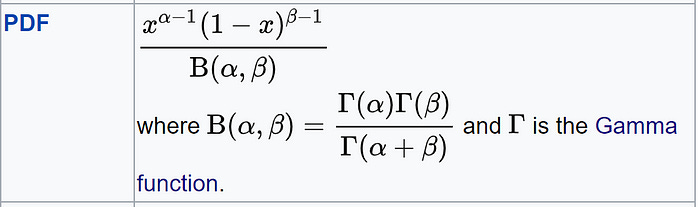
Beta Distribution PDF It is used to model probabilities, thus, it is bounded between [0,1].
Very similar to the binomial distribution. The difference is that binomial distribution models the number of successes, while beta distribution models the probability of success (p).
In other words, the probability is a parameter in the binomial distribution. But in the Beta distribution, the probability is a random variable.
Uniform Distribution

Uniform Distribution PDF A continuous probability distribution where all outcomes within a given range are equally likely.
It is parameterized by two parameters: a (minimum value) and b (maximum value).
Example: Simulating the roll of a fair six-sided die, where each outcome (1, 2, 3, 4, 5, 6) has an equal probability.
Log-Normal Distribution
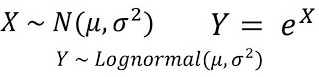
Log-Normal Distribution PDF A continuous probability distribution where the logarithm of the variable follows a normal distribution.
It is parameterized by two parameters—mean and standard deviation.
Example: Typically, in stock returns, the natural logarithm follows a normal distribution.


Over to you: What more distributions will you include here?
👉 Read what others are saying about this post on LinkedIn and Twitter.
👉 Tell the world what makes this newsletter special for you by leaving a review here :)
👉 If you liked this post, don’t forget to leave a like ❤️. It helps more people discover this newsletter on Substack and tells me that you appreciate reading these daily insights. The button is located towards the bottom of this email.
👉 If you love reading this newsletter, feel free to share it with friends!
👉 Sponsor the Daily Dose of Data Science Newsletter. More info here: Sponsorship details.
Find the code for my tips here: GitHub.
I like to explore, experiment and write about data science concepts and tools. You can read my articles on Medium. Also, you can connect with me on LinkedIn and Twitter.
The Pareto distribution (power law distribution). I think this is likely to be an important distribution to data science because so many important distributions related to social media and web usage end up being power lawed. Also, it turns up in so many areas from word frequencies (Zipf's law) to population density, to the distribution of wealth (like land in the 80/20 rule). It also very frequently shows up in network science, for example in the density distributions of various kinds of graphs. That said it isn't without controversy. It has been shown that the power law and log-normal distribution are very hard to tease apart (Clauset, et al, 2009), and that the ubiquity of power laws in the social and natural sciences may be overblown, there was a certain amount of hope that the frequency of power laws occurring in nature could be related to phenomena from complexity science like self organized criticality, it is now considered less likely that there is some connecting mechanisms between different occurrences of power laws and that rather various different generative mechanisms are involved in different cases, and as mentioned, it has turned out to be a lot less clear that these power laws are not potentially log-normal. But despite all that, there are some great packages, like poweRlaw for R, which allow you to fit power laws with the current gold standard in statistical methodology. For the reasons mentioned earlier I think that perhaps the pareto distribution (or power law, however you want to call it) should be included in place of the log-normal distribution.