

Stop Analysing Raw Tables. Use Styling Instead!
blog.dailydoseofds.com
Stop Analysing Raw Tables. Use Styling Instead!

Jupyter is a web-based IDE. Thus, whenever you print/display a DataFrame in Jupyter, it is rendered using HTML and CSS.
This means you can style your output in many different ways.
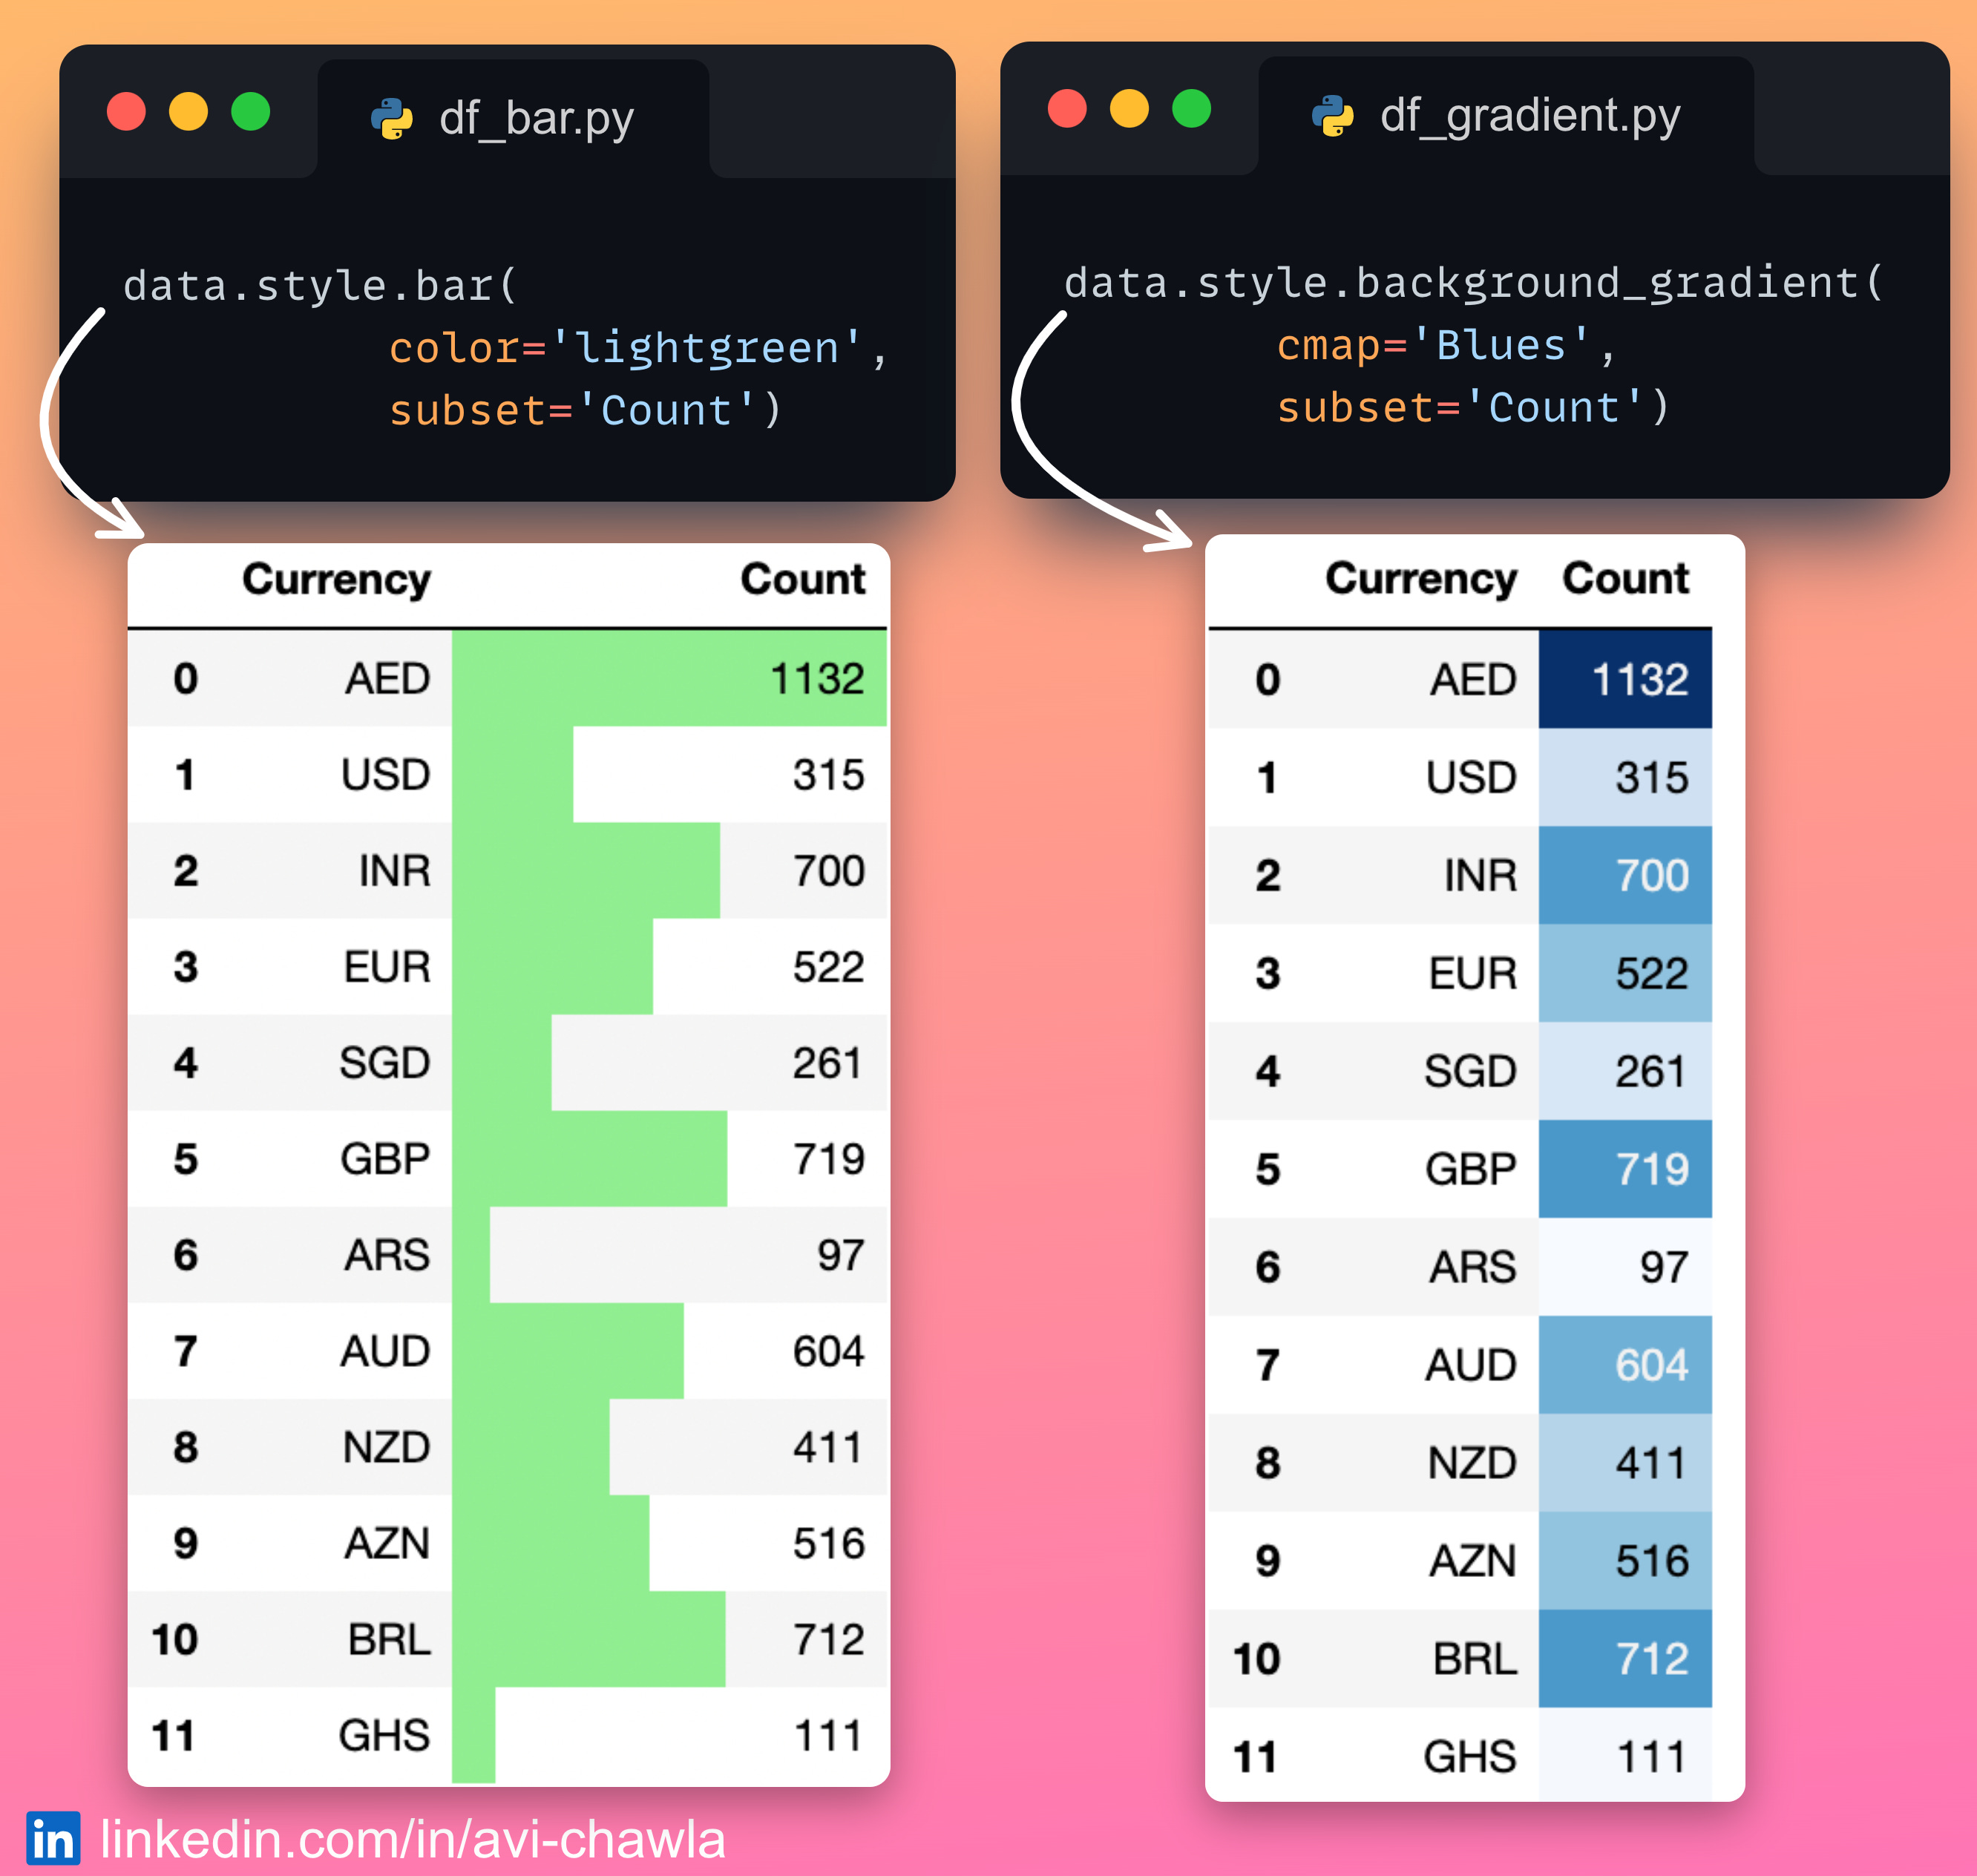
To do so, use the Styling API of Pandas. Here, you can make many different modifications to a DataFrame's styler object (𝗱𝗳.𝘀𝘁𝘆𝗹𝗲). As a result, the DataFrame will be displayed with the specified styling.
Styling makes these tables visually appealing. Moreover, it allows for better comprehensibility of data than viewing raw tables.
Read more here: Documentation.
Share this post on LinkedIn: Post Link.
I like to explore, experiment, and write about data science concepts and tools. You could connect with me on LinkedIn and read my work on Medium.