
The Ultimate Categorization of Performance Metrics in ML
Regression and classification metrics in a single frame.


Performance metrics are used to assess the performance of a model on a given dataset.
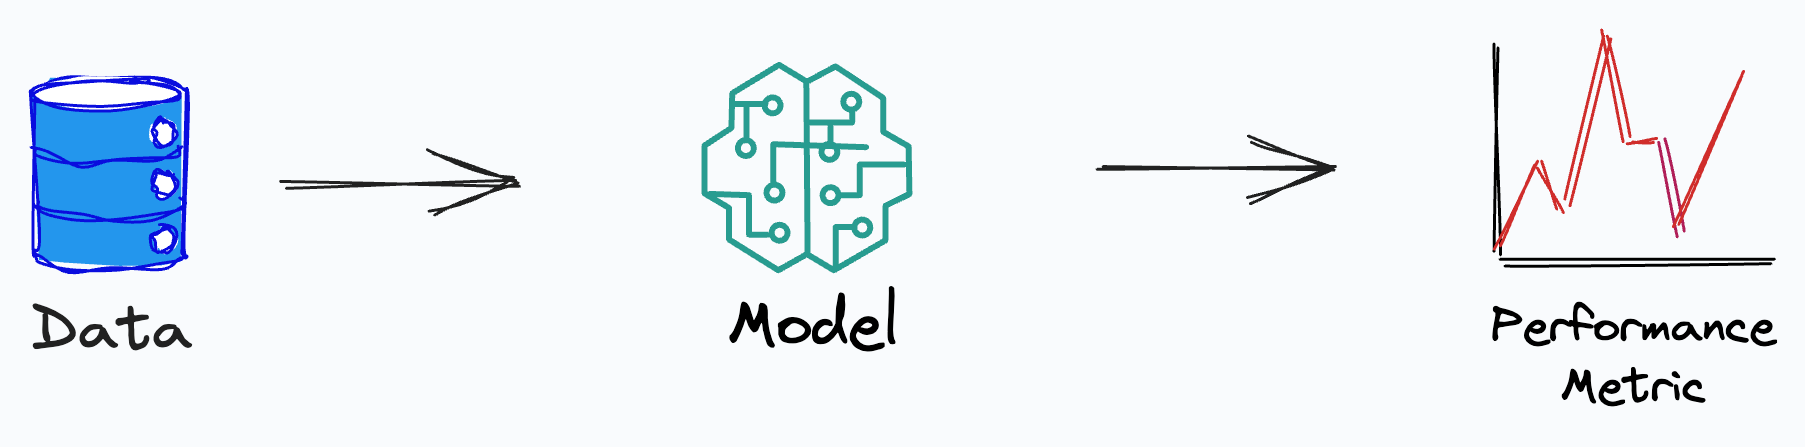
They provide quantitative ways to test the effectiveness of a model. They also help in identifying the areas for improvement and optimization.
Why Performance metrics?
Typically, it is difficult to interpret ML models (especially deep learning models). It is difficult to understand the specific patterns identified by the model from the given data.
Performance metrics allow us to determine their performance by providing unseen samples by evaluating the predictions.
This makes them a must-know in ML.
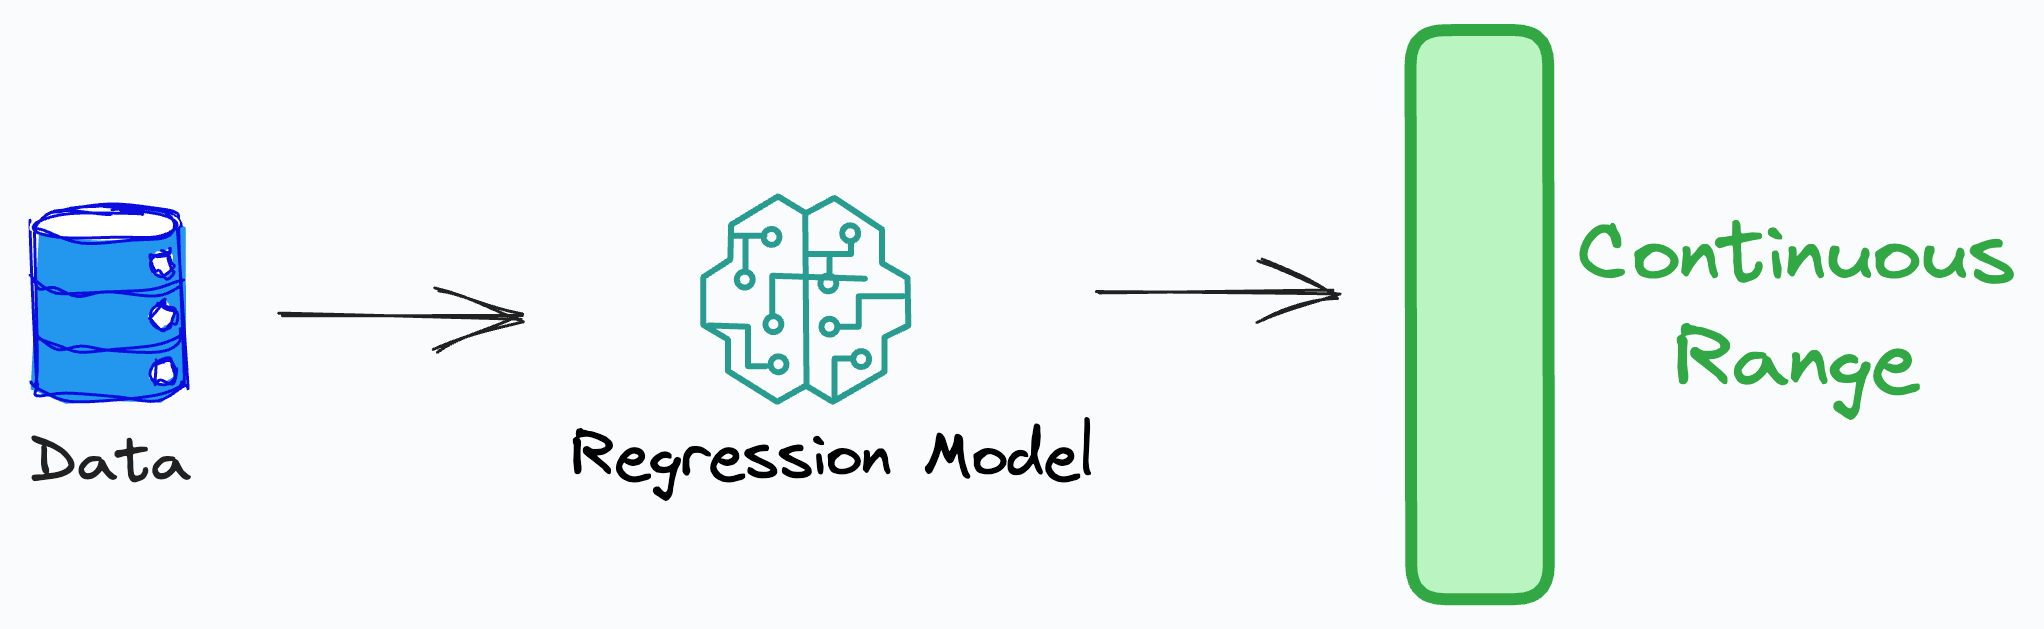
Performance Metrics for Regression
Mean Absolute Error (MAE):
Measures the average absolute difference between the predicted and actual value.
Provides a straightforward assessment of prediction accuracy.
Mean Squared Error (MSE):
Measures the average squared difference between the predicted and actual values.
Larger errors inflate the overall metric.
Root Mean Squared Error:
It is the square root of MSE.
R-squared:
Represents the proportion of the variance in the target variable explained by the regression model.
Adjusted R-squared:
Similar to R-squared.
But accounts for the number of predictors (features) in the model.
Penalizes model complexity.
Mean Absolute Percentage Error (MAPE):
Measures the average percentage difference between the predicted and actual values.
Typically used when the scale of the target variable is significant.
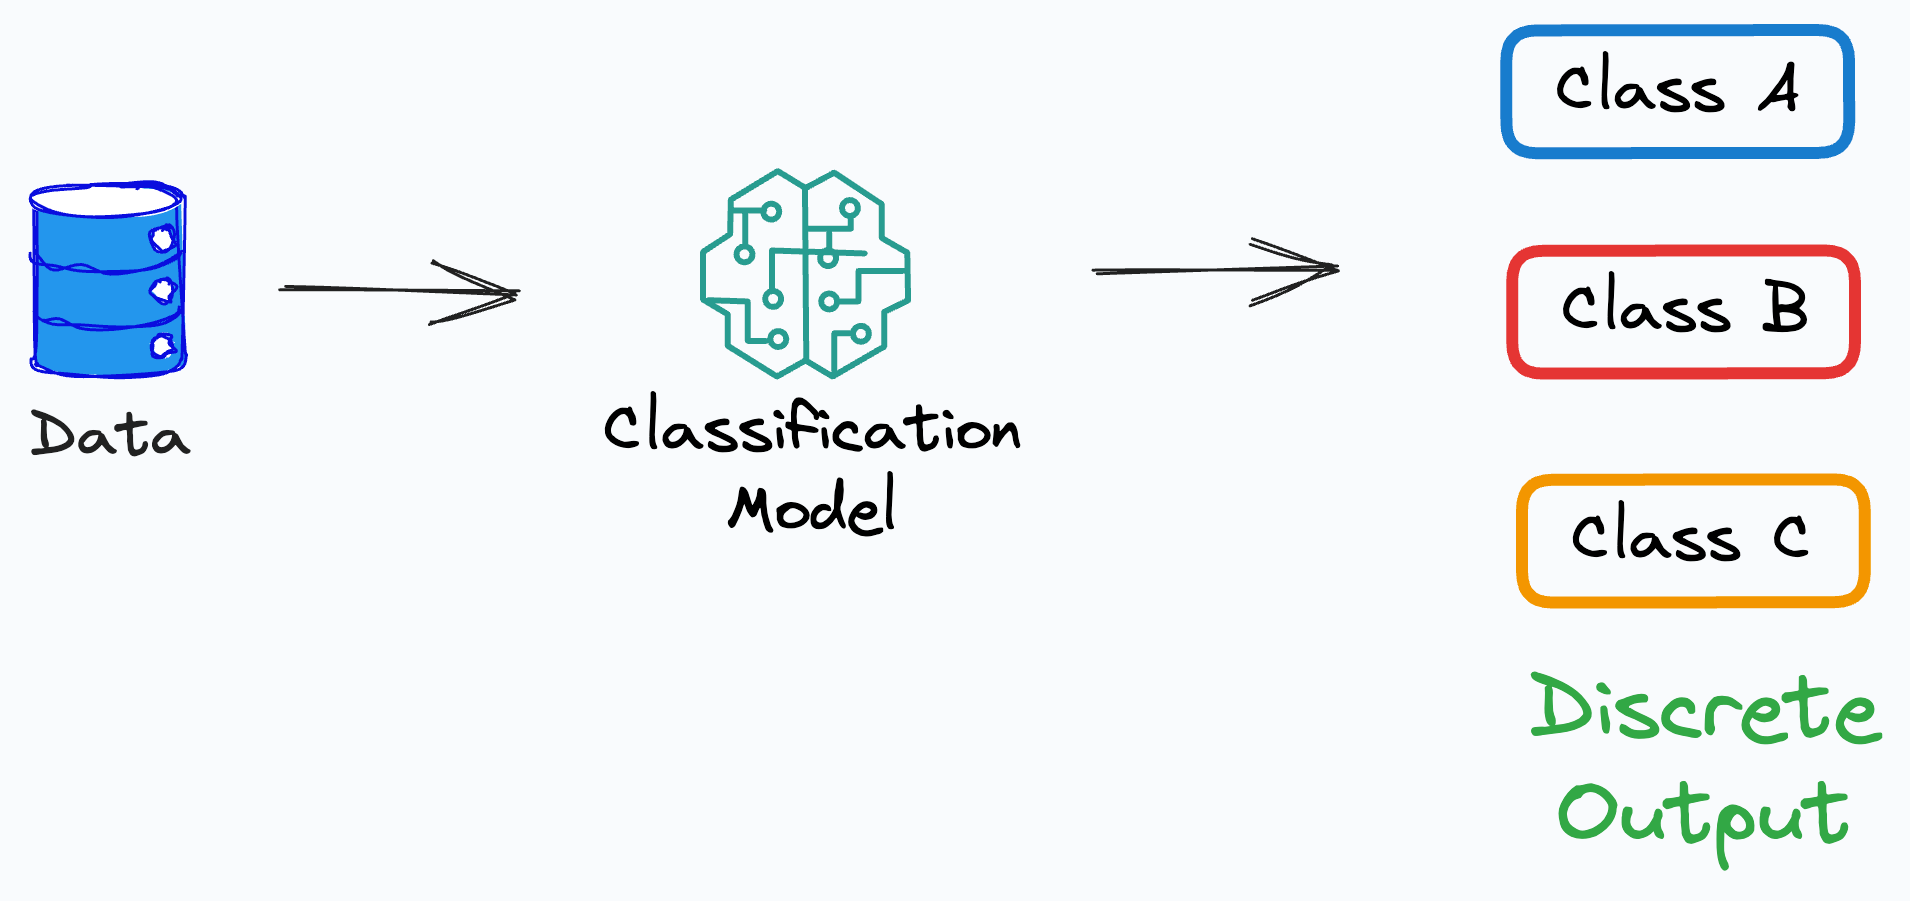
Performance Metrics for Classification
Accuracy:
Measures the proportion of correct predictions, irrespective of the class.
Provides an overall assessment of classification performance.
Precision:
Measures the proportion of positive predictions that were correct.
It is also called the accuracy of the model only on the positive predictions.
Recall (Sensitivity):
Measures the proportion of correctly classified positive samples in the dataset.
It is also called the accuracy of the model on positive instances in the dataset.
Precision → Accuracy on positive predictions.
Recall → Accuracy on positive instances in the dataset.
Read by Medium blog to understand more: Precision-Recall Blog.
Specificity:
Opposite of Recall.
Measures the proportion of correctly classified negative samples in the dataset.
It is also called the accuracy of the model on negative instances in the dataset.
Negative Predictive Value:
Opposite of Precision.
Measures the proportion of negative predictions that were correct.
It is also called the accuracy of the model only on the negative predictions.
Balanced Accuracy:
Computes the average of Recall (accuracy on positive predictions) and specificity (accuracy on negative predictions)
A better and less-misleading measure than Accuracy in the case of an imbalanced dataset.
F1-score:
The harmonic mean of precision and recall.
Provides a balanced measure between the two.
Matthews Correlation Coefficient (MCC):
Takes into account true positive (TP), true negative (TN), false positive (FP), and false negative (FN) predictions to measure the performance of the binary classifier.
Provides a balanced performance measure unaffected by class imbalance.
If you struggle to understand TP, TN, FP and FN, read my previous post: Use This Simple Technique To Never Struggle With TP, TN, FP and FN Again
👉 Over to you: What other metrics will you include here?
👉 Read what others are saying about this post on LinkedIn and Twitter.
👉 Tell the world what makes this newsletter special for you by leaving a review here :)
👉 If you liked this post, don’t forget to leave a like ❤️. It helps more people discover this newsletter on Substack and tells me that you appreciate reading these daily insights. The button is located towards the bottom of this email.
👉 If you love reading this newsletter, feel free to share it with friends!
👉 Sponsor the Daily Dose of Data Science Newsletter. More info here: Sponsorship details.
Find the code for my tips here: GitHub.
I like to explore, experiment and write about data science concepts and tools. You can read my articles on Medium. Also, you can connect with me on LinkedIn and Twitter.