
Why Correlation (and Other Summary Statistics) Can Be Misleading
...And here's how to avoid drawing misleading conclusions.

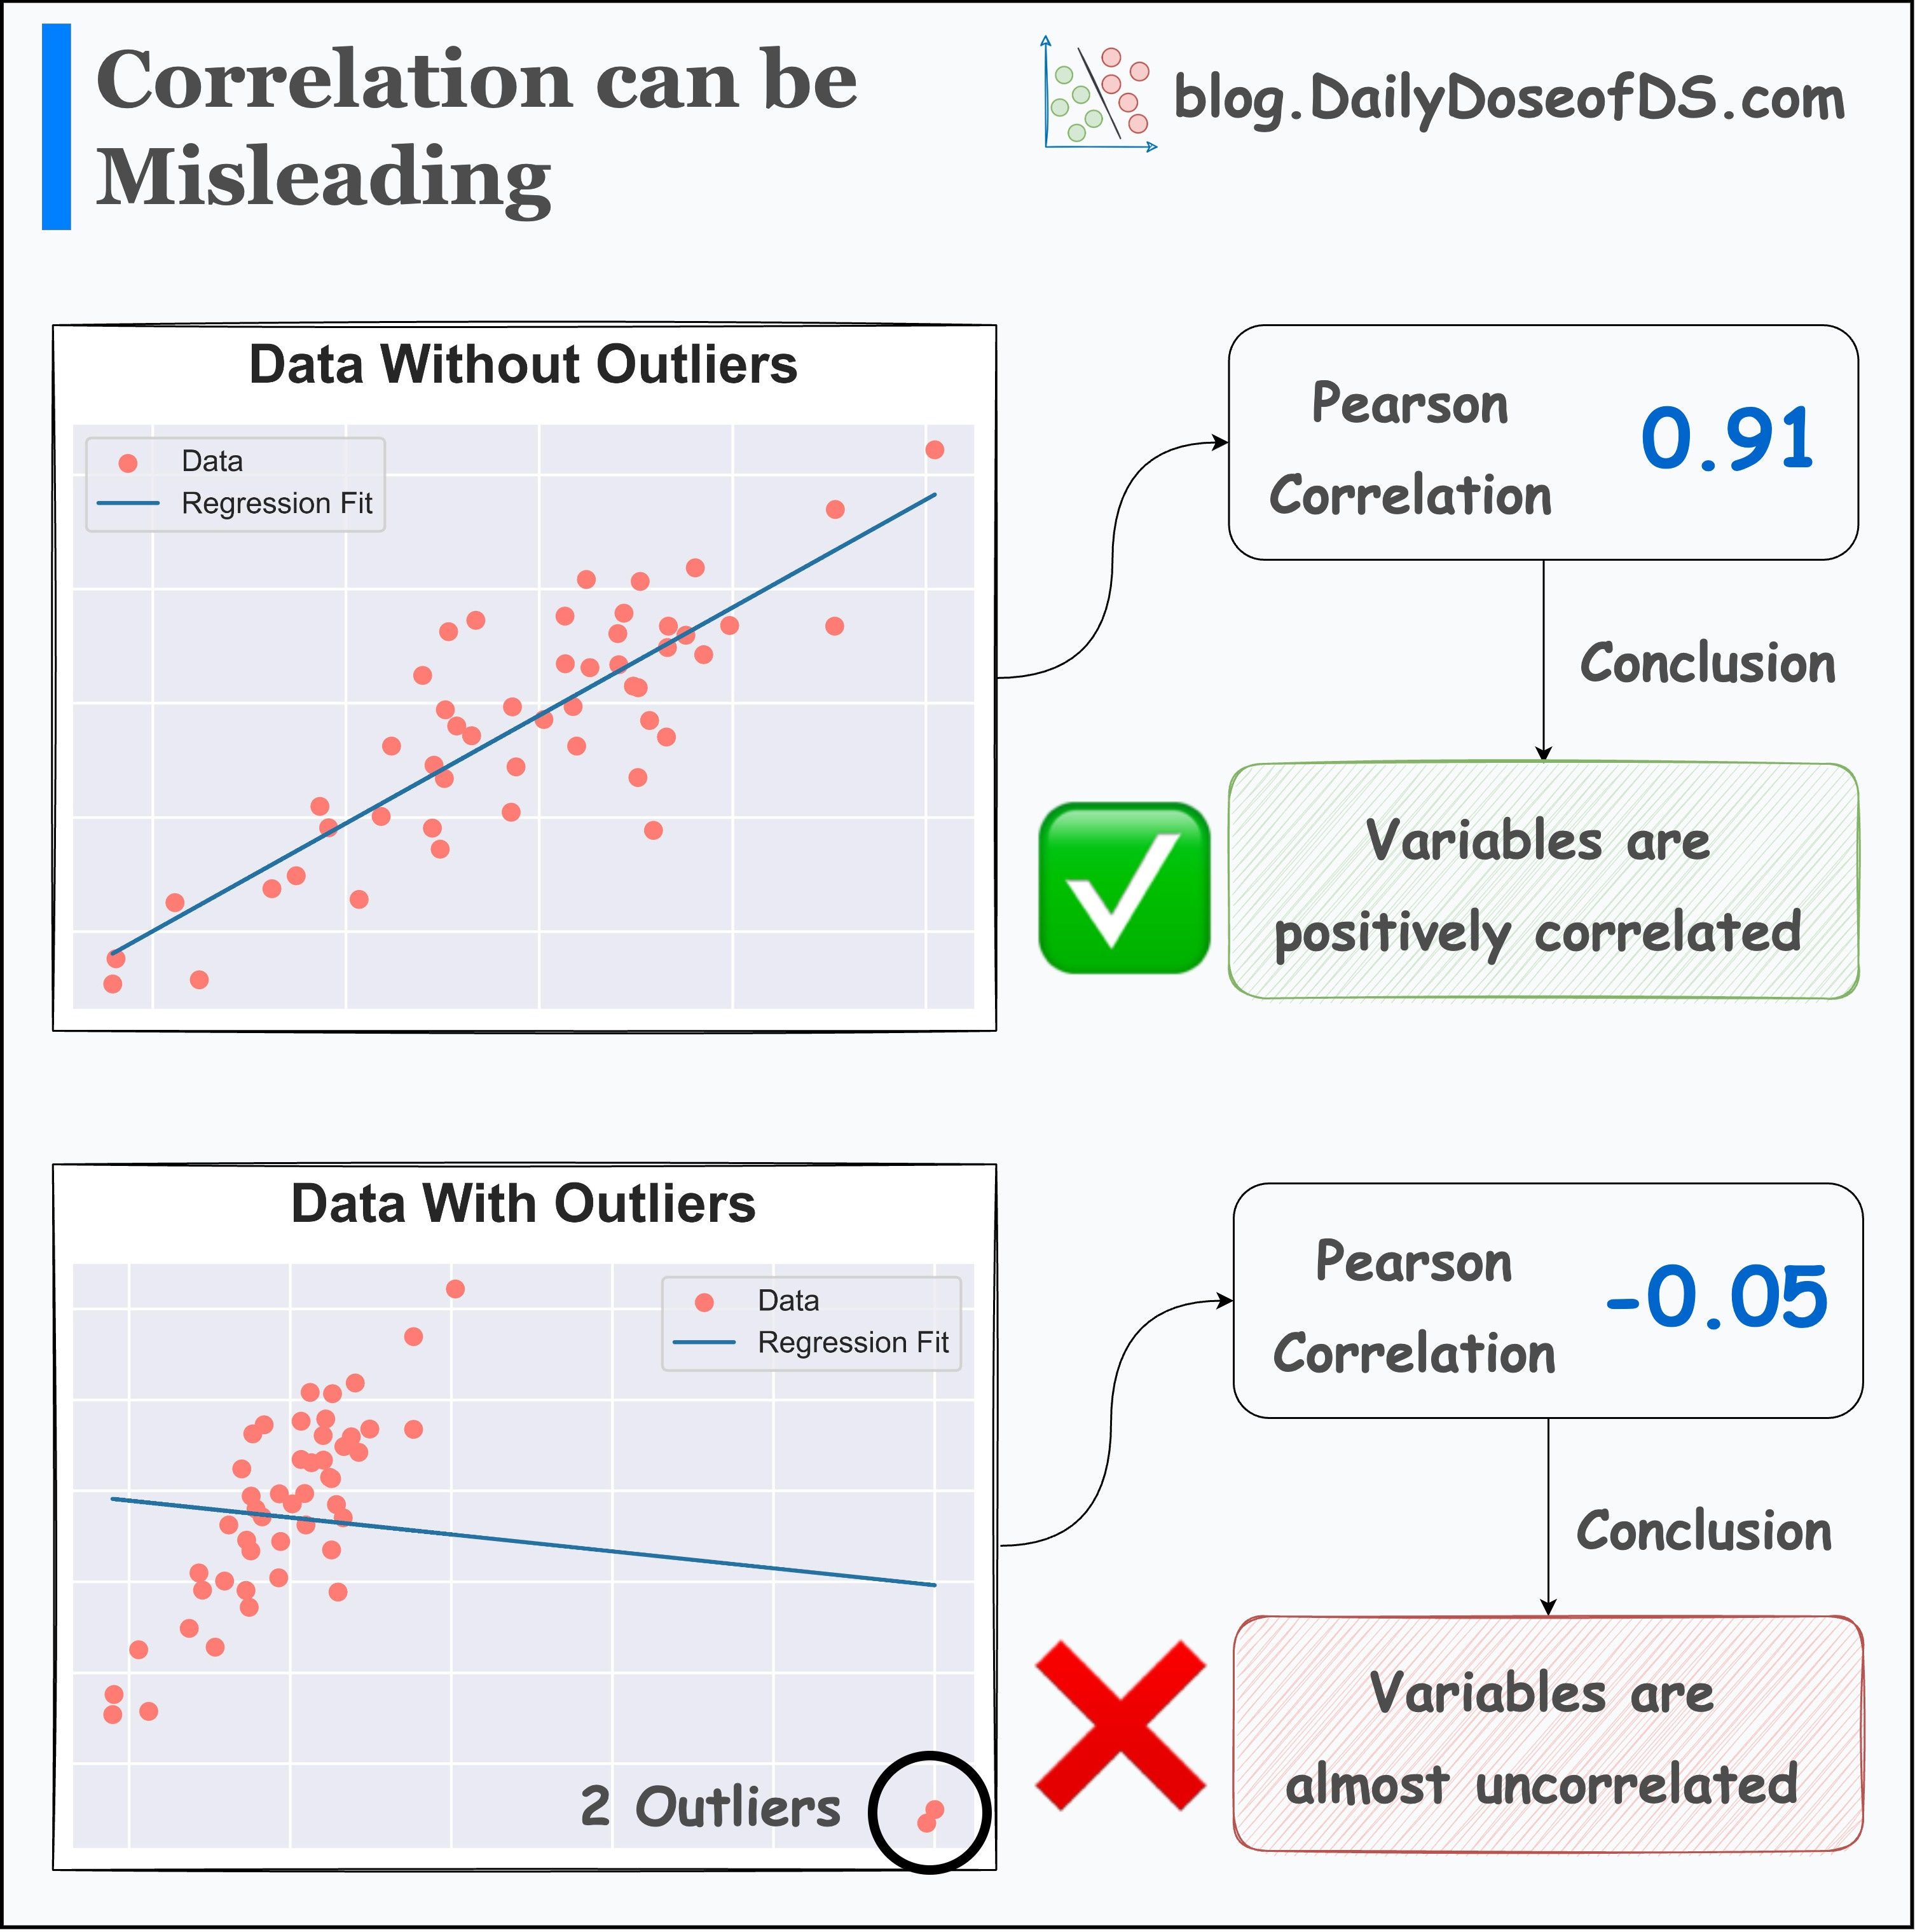
Many data scientists solely rely on the correlation matrix to study the association between variables.
But unknown to them, the obtained statistic can be heavily driven by outliers.
This is evident from the image above.
The addition of just two outliers drastically changed:
the correlation
the regression fit
Thus, plotting the data is highly important.
This can save you from drawing wrong conclusions, which you may have drawn otherwise by solely looking at the summary statistics.
One thing that I often do when using a correlation matrix is creating a PairPlot as well (shown below).
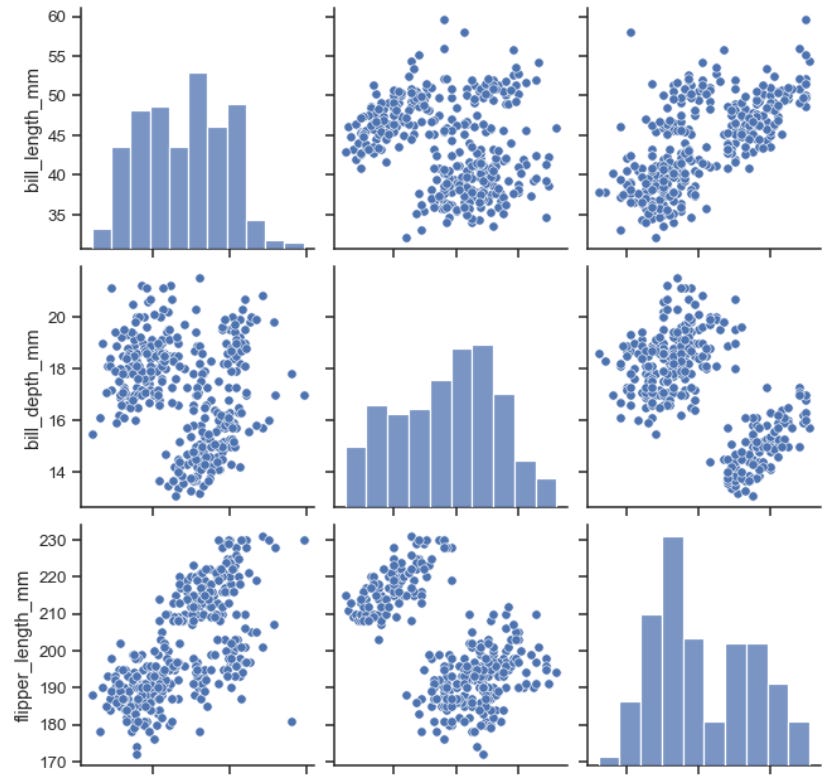
This lets me infer if the scatter plot of two variables and their corresponding correlation measure resonate with each other or not.
👉 Over to you: What are some other measures you take when using summary statistics?
👉 If you liked this post, don’t forget to leave a like ❤️. It helps more people discover this newsletter on Substack and tells me that you appreciate reading these daily insights. The button is located towards the bottom of this email.
Thanks for reading!
Latest full articles
If you’re not a full subscriber, here’s what you missed last month:
Sklearn Models are Not Deployment Friendly! Supercharge Them With Tensor Computations.
Deploy, Version Control, and Manage ML Models Right From Your Jupyter Notebook with Modelbit
Model Compression: A Critical Step Towards Efficient Machine Learning.
Generalized Linear Models (GLMs): The Supercharged Linear Regression.
Gaussian Mixture Models (GMMs): The Flexible Twin of KMeans.
To receive all full articles and support the Daily Dose of Data Science, consider subscribing:
👉 Tell the world what makes this newsletter special for you by leaving a review here :)
👉 If you love reading this newsletter, feel free to share it with friends!
How to deal with that 2 outliers? Please advise
If there are too many variables to plot individually, then Spearman's rank correlation can provide a robust measure of the association between each pair of variables.